A project plan can hold hundreds of tasks. Nobody can read them all every morning, and nobody needs to. What you need is a few honest answers. Are we on time? Are we on budget? Who is overloaded? What needs attention today? A project dashboard gives you those answers on one screen. This page explains what a project dashboard is, what it should show, and how to read one, using a real hospital building plan.
Part 1: The basics
What is a project dashboard?
A project dashboard is one page that sums up the state of a project: progress, cost, dates, people and problems, shown as a few dials, charts and short lists instead of rows of tasks. You will also see it called a project management dashboard or a project tracking dashboard. They all mean the same thing.
A good dashboard has three qualities:
- It comes from the plan itself. If someone has to copy figures into a spreadsheet every Friday, the dashboard is out of date by Monday.
- It compares, not just counts. “12% done” means little on its own. “12% done, where 18% should be done by today” tells you the project is behind.
- It points to the work. A warning is only useful if you can go straight to the tasks behind it.
What a project dashboard should show
Most of what a project manager, a client or a board wants to know fits into five questions.
- How far along are we, against where we should be? Percent complete is only half the story. The other half is how much should be complete by today.
- Will it cost what we budgeted? The forecast cost of the whole project against its budget, and how much is left to spare, or how much it is over.
- When will we really finish? The finish date the plan now gives, against the finish date everyone agreed at the start: the baseline.
- Is anyone overloaded? A plan can look fine on paper while one team is booked for twice the hours it can work.
- What needs attention now? The tasks that are late, the milestones coming up, and the critical tasks that decide the finish date.
Part 2: A real example
A project dashboard example: a hospital build
Here is a real construction project dashboard in Desktop Plan. The plan is a hospital build, the Harbourside Medical Centre, with 187 tasks and a budget of $48 million. Today is 5 October 2026. Let’s read its dashboard and answer the five questions.
The dashboard strip: three dials above the plan
The first part of the dashboard sits just under the project’s name, above the tasks, so it stays in view while you work.

- Complete: 12%, where 18% should be done by today. So the work is 6 points behind. That is question 1 answered in one glance.
- Cost: 96% of the budget. The whole project is forecast to cost $46,236,496, out of $48,000,000, with $1,763,504 to spare. Note what this dial does not say. 96% is the forecast for the whole project, not what has been spent so far. It answers question 2: on today’s estimates, the project fits the budget, with about 4% to spare.
- Status: 187 tasks. 11 are done, 16 are under way and 160 are still to start.
The full dashboard page
For the whole picture, the full dashboard page adds a fourth dial and the charts.

- Finish: 5 June 2028, 49 working days behind the baseline. The dial is red. This answers question 3, and it is the most important number on the page. Being 6 points behind sounds small, but the late work holds up everything that waits for it, and the plan now ends about ten weeks later.
- Progress over time shows how much should be done by each date: the solid line is the plan, the dashed line is the baseline. Today’s orange dot sits below the line, so the work is behind.
- Status splits each phase into completed, under way and planned work, and counts its late tasks. Pre-construction has 7 and Substructure has 8: 15 late tasks, all in the first two phases.
- Cost compares each phase’s baseline, estimated and actual cost. Planned spend by quarter shows when the money goes out, which is what a finance team needs for cash flow.
Who is overloaded, and what needs attention
Further down the page are the people and the lists.
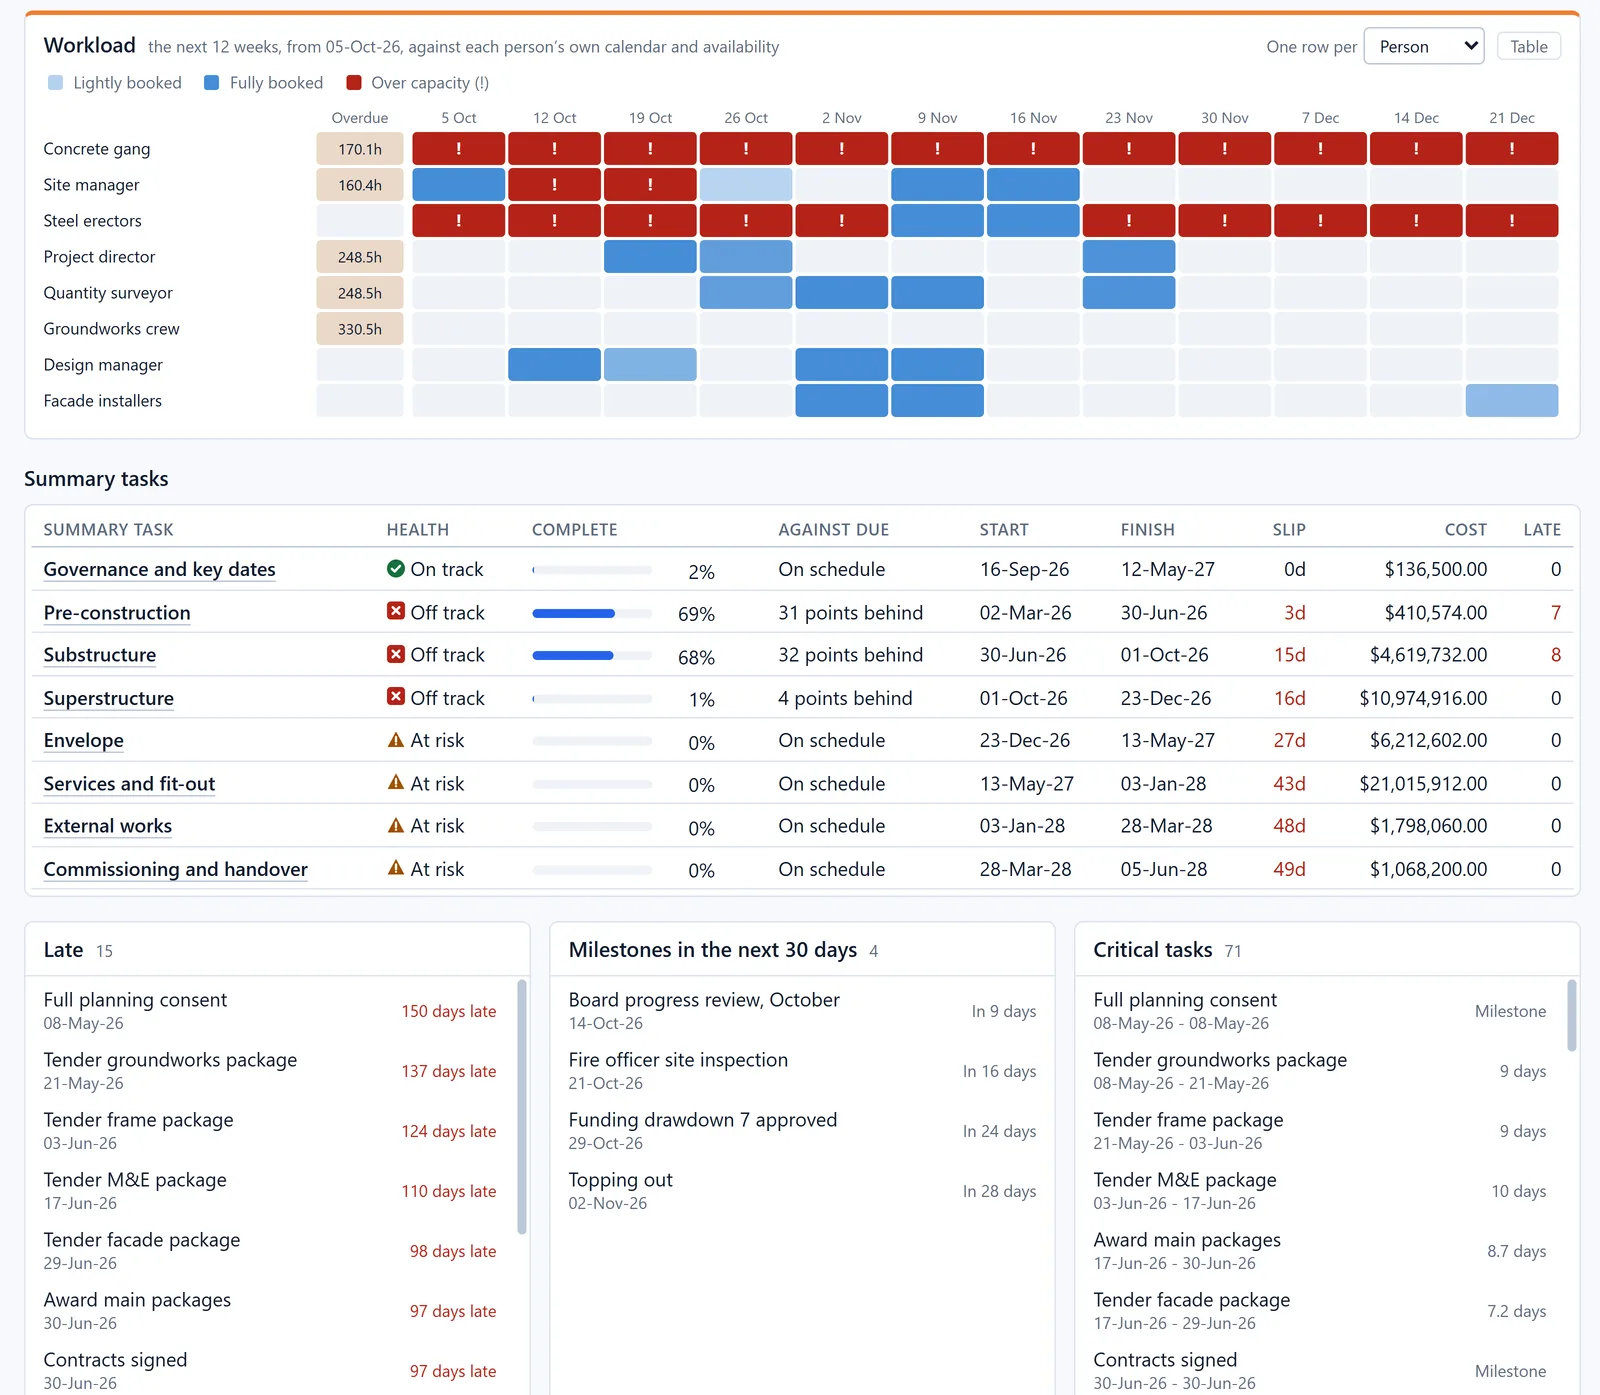
- Workload shows each person’s booked hours for the next 12 weeks, against their own working calendar. Red means over capacity. The concrete gang is over capacity in all twelve weeks, and the steel erectors in most of them. That answers question 4. No amount of reporting will make up those hours. The work needs more people, or more time.
- Summary tasks rates every phase: on track, at risk or off track. Here three phases are off track: Pre-construction, Substructure and Superstructure. The four that haven’t started yet are at risk, because the delay before them pushes them later.
- Late, Milestones in the next 30 days, and Critical tasks answer question 5. There are 15 late tasks, the oldest being the full planning consent. 4 milestones fall in the next 30 days, the next one a board progress review in 9 days. And 71 critical tasks decide the finish date.
So in under a minute, the dashboard has told us this. The project is fine on budget. It is behind on time, by enough to move the finish by ten weeks. The delay comes from late tender and approval work in the first two phases. And one crew is overbooked for the next three months. That is the conversation to have at the next site meeting.
On track, at risk or off track: what the colours mean
A dashboard is only as useful as its warnings are honest. In Desktop Plan, a phase or a project is marked:
- On track when none of the warning signs below apply;
- At risk when it is 5 points or more behind where it should be, or over budget, or finishing late by more than 5% of its planned length;
- Off track when it is 15 points or more behind, or more than 10% over budget, or finishing late by more than 15% of its planned length.
The same idea works for any dashboard. Agree the thresholds once, at the start, so that red means the same thing to everyone.
Part 3: In Desktop Plan
All your projects on one page
With more than one project running, the questions are the same, but you want the answers for all of them at once. That is often called a multi-project or portfolio dashboard.
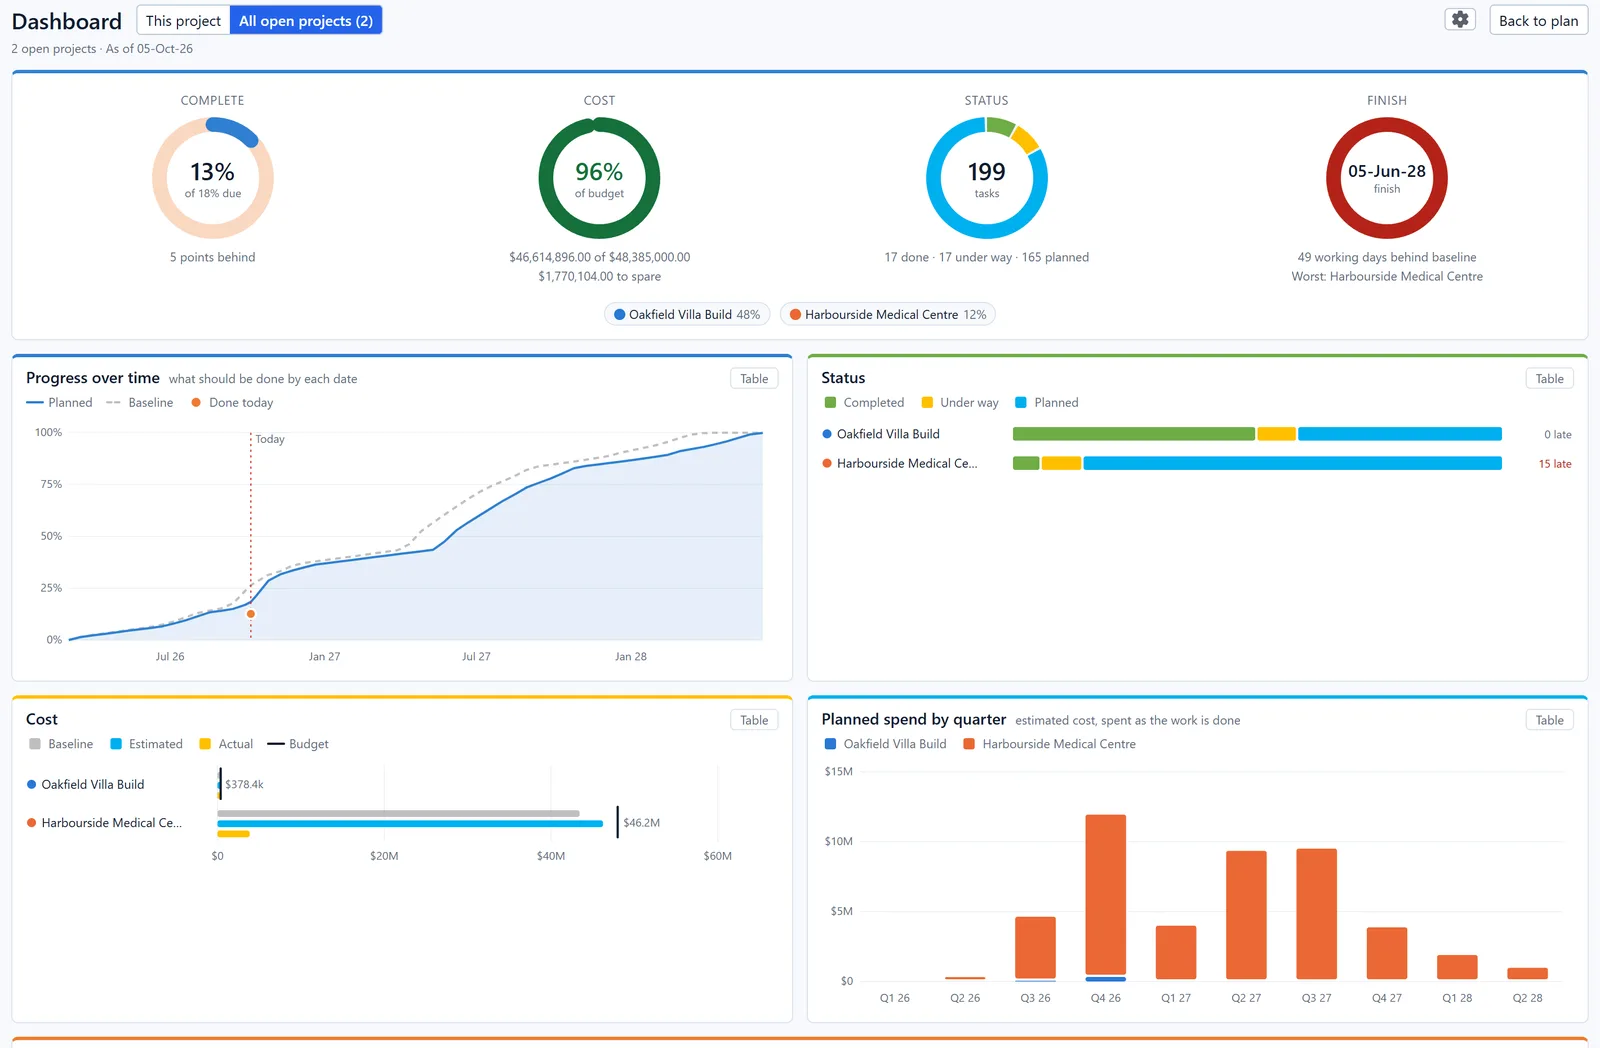
In Desktop Plan, All open projects puts every open plan on one dashboard. The dials add them up, each project gets its own colour in the charts, and the Finish dial names the one furthest behind. Here, the Oakfield Villa Build is 48% done with no late tasks. The Harbourside Medical Centre is the one to worry about.
How to make a project dashboard
You can build a dashboard by hand in a spreadsheet, with charts that read from a task list. It works, but someone has to keep the figures up to date, and it rarely shows the workload or the critical path.
Planning software can build it from the plan instead. In Desktop Plan, the dashboard strip sits above every plan. In Desktop Plan Pro, press F11 for the full dashboard page: nothing to set up. Every chart has a Table button for the exact figures. A gear chooses which charts appear. Click any task in a list to jump straight to it in the plan. To share the page, click Export for a PDF.
Three things make any dashboard more truthful:
- Set a baseline when the plan is agreed, so there is something to compare the finish date with.
- Update progress regularly. A dashboard can only be as current as the percent complete it reads.
- Give tasks costs and people. Without them, the cost and workload charts have nothing to show.
Watch every chart in detail: How to use the dashboard in Desktop Plan (13 minutes) →
Questions
Common questions
What is the difference between a project dashboard and a project report?
A report is a document written at a point in time, often weekly or monthly. A dashboard is live: it changes as the plan changes. Many teams use the dashboard to write the report, and some simply export the dashboard as the report.
What should be on a project dashboard?
At least progress against where it should be, cost against budget, and the finish date against the baseline. Add workload and the lists of late, upcoming and critical tasks, and most status meetings can be run from the dashboard alone.
Why does the dashboard need a baseline?
Without a baseline there is nothing to measure slippage against. The dashboard can say when the plan now finishes, but not whether that is later than agreed.
Why can a project be on budget and still be in trouble?
Because cost and time are separate questions. The Harbourside Medical Centre is forecast at 96% of its budget, yet it is 49 working days behind. A dashboard that showed only cost would look fine.
Learn more
- How to use the dashboard in Desktop Plan, the full video
- The dashboard in the Desktop Plan user guide
- What decides your finish date: the critical path, explained simply
- Download Desktop Plan
See your own project on one dashboard
Desktop Plan is free to download. The dashboard strip sits above every plan, and Desktop Plan Pro adds the full dashboard page.
Windows 10 and 11, 64-bit · macOS 13 or later